
Observability in Enterprise Applications: Metrics, Logs, Traces
Building the three pillars of observability — metrics, logs, distributed traces — in the Spring ecosystem: Micrometer, OpenTelemetry, structured logging, correlation and alert design.
Is observability more than monitoring?
Yes — monitoring is dashboards for questions you knew in advance; observability is the ability to answer questions you did not know you would ask, in production. 'What is the CPU at?' is monitoring; 'which service held this customer's order yesterday, and why did it wait 4 seconds?' is observability. The capability is built on three pillars — metrics, logs and distributed traces — and the real value lies in correlating them.
The three pillars and their Spring counterparts
Pillar | Question it answers | Spring tool |
|---|---|---|
Metrics | How much, how fast, trending how? | Micrometer (+ Actuator) |
Logs | What exactly happened, in what context? | SLF4J/Logback, structured (JSON) output |
Traces | Which services did the request cross, where did it wait? | Micrometer Tracing / OpenTelemetry |
On the standards side the direction is clear: OpenTelemetry has become the industry's shared language for collecting and transporting all three signals, and current Spring Boot versions plug into that ecosystem natively through Micrometer bridges. The tool-independent principle: instrumentation should lean on the standard layer, not on application code — so the telemetry survives even if the backend vendor changes.
Correlation: the thread that ties the pillars
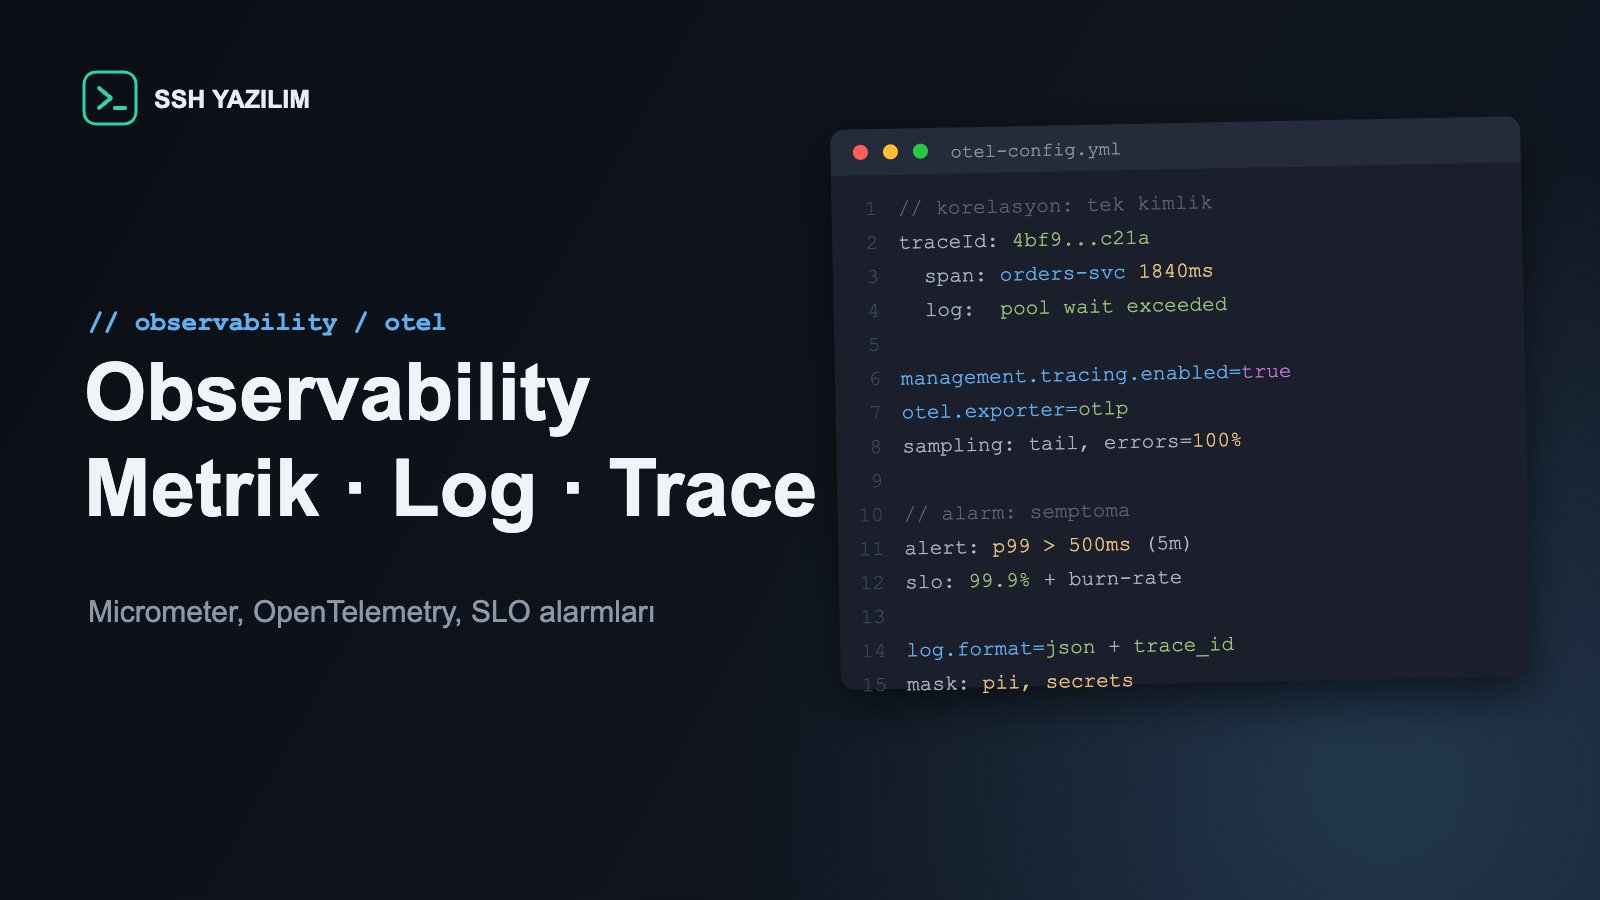
The pillars produce power not when they live on separate dashboards but when they are joined by one identity: every request carries a trace ID; log lines include it automatically (via MDC); metric exemplars point to the relevant trace. The resulting flow: you see a p99 spike on the dashboard → click through to a sample trace → find the slow span → drop into that span's logs by the same ID. Every link in the chain takes setup; once built, mean time to diagnosis falls from hours to minutes.
Structured logging: a log is data
Text logs are for humans; production logs are for machines. JSON logs with standard fields (timestamp, level, service, trace_id, tenant/customer context) are the precondition for central search, field-based filtering and alert rules. Two disciplines come with them: sensitive-data masking (personal data and secrets never land in logs) and volume management — correct level usage, sampling and retention policy control the logging bill. 'Collect everything at DEBUG' is not observability; it is cost and noise.
Metric design: RED/USE and label discipline
For services, the RED framework (Rate, Errors, Duration) is the minimum set; USE (Utilization, Saturation, Errors) joins for resources. With Micrometer, custom business metrics (order count, payment failures, queue write time) flow through the same pipeline — technical and business dashboards feed on the same data. The critical discipline is labels: high-cardinality labels (like user IDs) bloat the metric system; choose the label set deliberately and leave per-individual analysis to traces/logs.
Alert design: alert on symptoms, dashboard the causes
The alerting philosophy in one line: alerts are wired to user-affecting symptoms (error rate, p99, queue lag); causes (CPU, GC, pool saturation) stay on dashboards for diagnosis. Every alert needs a runbook and an owner; an alert that fires repeatedly without producing action creates alert fatigue and costs you in a real incident. The SLO-based approach — objective, error budget, burn-rate alerts — is the proven way to cut alert noise with engineering discipline.
Business impact: diagnosis time is a cost line
Every minute lost during an outage is booked as revenue, reputation and SLA penalties; the return on observability is measured exactly there: falling mean time to diagnosis and resolution (MTTR). The second return is contractual: committing SLOs to enterprise customers is only possible on this infrastructure — 'we say 99.9 because we measure it' is a strong sentence in a sales meeting. The third is cultural: a team that looks at data moves arguments from guesses to measurements.
Frequently asked questions
Are all three pillars mandatory; where do I start?
Start with metrics + structured logs, and add the correlation ID from day one. Tracing yields its highest return as service count grows — its priority rises as the architecture distributes.
Does sampling lose data?
Full trace retention is unnecessary and expensive at most scales; tail-based/error-first sampling (always keep failed and slow traces) is the practical balance.
Which backend should I choose?
Instrument with OpenTelemetry and the backend (open-source stack or commercial APM) becomes a replaceable decision. Lock-in is avoided at the instrumentation layer and through data ownership.
How is personal data in logs governed?
Masking filters live in the central logging layer; field-level access and retention align with your KVKK/GDPR inventory. A log store is a personal-data store and must be governed as one.
Observability checklist
Micrometer metrics + RED dashboards active
Logs in JSON; trace_id on every line (MDC)
Distributed tracing with OpenTelemetry and a sampling policy in place
The metric-trace-log correlation chain works end to end
Label cardinality controlled; sensitive-data masking active
Alerts symptom-based; every alert has a runbook and an owner
SLOs defined; error budgets reported
SSH Yazılım builds observability infrastructure end to end on Spring-based systems — from instrumentation to alert design. Let us bring your diagnosis time down to minutes together.