
Spring Boot Performance: A Methodology from Profiling to JVM Tuning
A methodology for Spring Boot performance work: measurement and profiling tools (JFR, async-profiler), the recurring bottleneck classes, connection pool and cache tuning, GC and heap configuration.
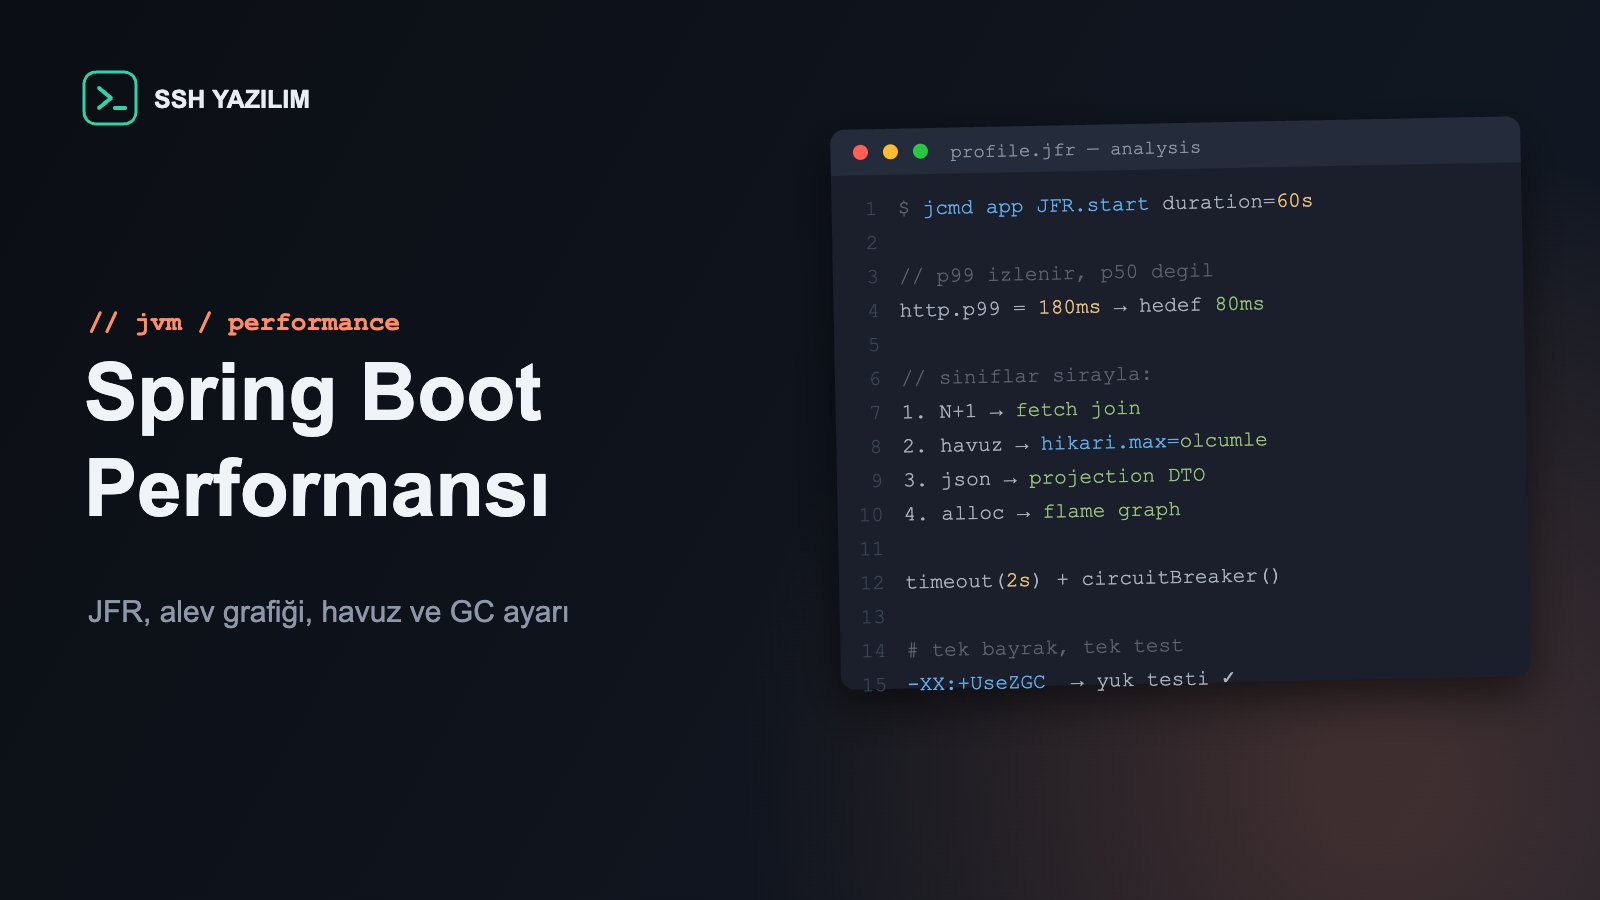
Why is my Spring Boot application slow?
The only engineering answer is: 'we cannot know without measuring.' Performance work starts with a profile, not a guess — and experience shows most slowness in Spring applications comes from a small set of recurring bottleneck classes: database access patterns, connection pool saturation, serialization cost and mis-sized memory. This article presents a methodology that diagnoses and closes those classes in order.
The measurement toolset: what to use when
Tool | What it gives | When |
|---|---|---|
Micrometer + APM | Request latency distribution, per-layer breakdown | Continuously; the first look is always here |
JDK Flight Recorder (JFR) | Low-overhead production profile: CPU, allocation, locks | Recording suspicious windows in production |
async-profiler | Flame graphs of CPU/allocation hot spots | Deep CPU analysis; in test/staging |
Slow query log | The database side's real cost | Always on; threshold defined |
Heap dump analysis | Memory retention, leak suspicion | OOM or growing-heap cases |
The golden rule: watch p95/p99, not p50 — averages hide the bad experience your users actually get.
Bottleneck class 1: database access patterns
The first suspect in a Spring application is always the data layer. N+1 queries (a query per list row), unnecessary eager association loading, transactions spanning entire service methods, and unindexed filters — the four classics. Diagnosis is simple: log the number of queries a request produces; if it grows with page items, you have N+1. The fixes are equally known: deliberate loading with fetch joins/entity graphs, projection queries for only the needed fields, short transaction scope, and indexing driven by query plans. Skipping to JVM tuning before closing this class is painting the walls of a house with a leaking roof.
Bottleneck class 2: pools and saturation
If the latency curve 'suddenly steepens at a certain load', the classic suspect is saturation: the connection pool (HikariCP), a thread pool or an outbound client pool has filled and requests are waiting in line. Put pool metrics (active/waiting/wait time) on a dashboard for diagnosis. The tuning principle is counterintuitive: growing the pool is usually not the fix — a pool beyond the database's parallel capacity merely relocates the waiting. The right order: shorten query times first, then size the pool by measurement, and stop wait propagation on outbound calls with timeouts + circuit breakers.
Bottleneck class 3: serialization and response size
In high-traffic APIs, JSON serialization and bloated responses are an invisible tax: fields the client never uses, deep object graphs and repeated metadata burn both CPU and bandwidth. The fix set: trimming responses with DTOs/projections, mandatory pagination, correctly configured compression (gzip) and HTTP cache headers on frequently requested stable responses. When Jackson stacks climb to the top of your profile, this is where to look.
Bottleneck class 4: memory and GC
GC tuning is last on the list — because most 'GC problems' are really allocation problems: needless per-request object churn (huge intermediate lists, repeated string concatenation, unchecked log objects) exhausts the collector. First find the producers with an allocation profile (JFR/async-profiler); then size the heap in harmony with the container limit; consider low-pause collectors (such as ZGC) when pause targets are critical. Apply tuning changes one at a time, validated by load tests — a team that flips five flags at once never learns which one worked.
Startup time and footprint: when it matters
In scale-out and serverless scenarios startup time is performance too: pruning unneeded auto-configurations, deliberate lazy initialization, and mechanisms like CDS/AOT shorten boot. Native images (GraalVM) are the far end of the spectrum; weigh the startup speed against build constraints and profiling differences.
Business impact: performance is capacity and the bill
Serving twice the requests on the same hardware means halving the cloud bill; lowering p99 latency shows up directly in conversion and satisfaction. The output of methodical performance work is not a one-off speedup but a lasting engineering capability: dashboards, a load-testing process and a 'performance budget' practice. That capability also strengthens your hand in enterprise SLA negotiations.
Frequently asked questions
Is profiling in production safe?
JFR was designed for it: recordings run in production with low overhead. Still, open recording windows deliberately and review outputs for sensitive data.
Does adding a cache always speed things up?
No — wrong key/invalidation design produces stale data and bugs; a cache whose hit ratio is not monitored merely occupies memory. Caches are added to measured hot spots.
Do virtual threads solve performance problems?
They greatly relax concurrency in wait-heavy workloads; they do not fix CPU-bound bottlenecks, N+1 or a saturated database. Class diagnosis is still required.
What should I load test with, and how?
With production-like data and realistic scenarios (JMeter/Gatling/k6 — the tool matters less); what matters is defined p95/p99 targets and repeatability in CI.
Performance checklist
p95/p99 dashboards and layer breakdown active
Queries-per-request monitored; N+1 scan done
Pool metrics dashboarded; timeouts + circuit breakers defined
Responses trimmed with DTOs/projections; pagination mandatory
Allocation profile taken; heap in harmony with container limits
Tuning changes applied one at a time, validated by load tests
Performance budget and pre-release test process written
SSH Yazılım performs measurement-driven performance diagnosis and optimization for Spring Boot applications. Let us map your application's bottlenecks together.